

Desk Notes
The Dividend I Chased and the Cut That Followed
I bought a stock because of one number on a screen. The number that would have warned me was on the same page, one line down, and I never divided it.
I bought a stock because of one number on a screen. I want to say that plainly, because everything that came afterwards follows from it.
I was building a small part of my portfolio to produce cash. On a page of two and three percent yields, there sat a well known company with a long history of paying, at about nine percent. It stood out the way a lit window stands out.
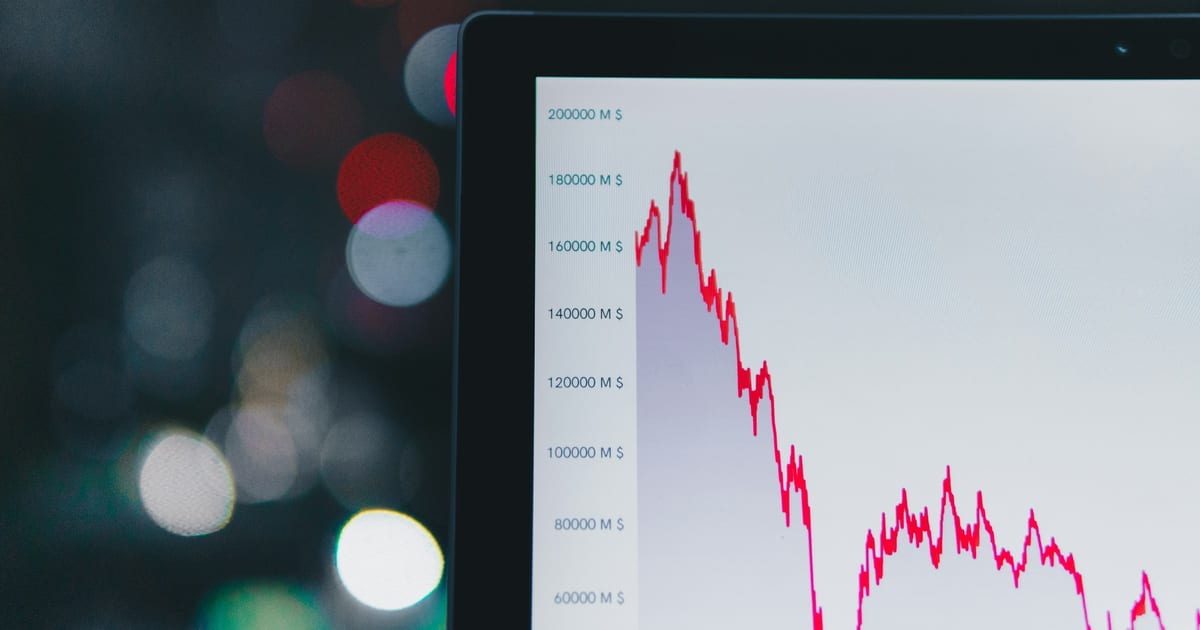
A yield is dividend / price. At $1.30 a share of dividend and a nine percent yield, the shares were around 1.30 / 0.09 = 14.44. A few years earlier the same $1.30 at a four percent yield would have put them near $32.50. Nothing about the dividend had gone up. The price had come down by more than half. So the yield I sat there admiring was the arithmetic of that fall, a number manufactured by other people selling, and I read it as a number manufactured by a generous board.
The division I did not do
A dividend is paid out of what a business earns. The first question is whether the earnings cover it, and the sum is payout ratio = dividend per share / earnings per share.
The company was paying $1.30 while earning around $1.20. That is 1.30 / 1.20 = 1.08. More was going out than coming in. It had been that way a while, with the gap funded by borrowing and by selling off pieces of itself, which is a thing a business can do for a year or two and cannot do forever. Fifteen seconds. Two numbers, both of them already on the page I had open.
There was a second check I skipped. Same sum, against free cash flow, which is the money left after the business has paid for the equipment and the investment it needs to keep running. Earnings can be shaped by accounting choices. Cash is harder to dress up. On that measure the coverage looked worse.
What the cut did, which was worse than I expected
It arrived with quarterly results, in the flat reasonable language these announcements always use. The new dividend was under a third of the old one.
The share price fell hard the same morning. That double effect is the part income investors underestimate, and I had never modelled it at all. The cut removes the reason a large group of holders own the stock, so they sell, and the cut also confirms the problem the market had suspected, so everyone else marks it down to match, which means you lose the income and take a capital loss out of the same sentence in the same press release.
Then I held on. That was a second mistake, made entirely to avoid admitting the first one. I told myself I was waiting for the price to recover to somewhere I would feel better about selling, which is a sentence about my own feelings and carries no information whatsoever about the company. It came out at a loss larger than every dividend it had ever paid me. That arithmetic is what made the lesson stick.
The order I ask questions in now
The payout ratio first, against earnings and against free cash flow. Anything near or above one is a reason to stop.
The reason the yield is high, second. If the price fell because the whole sector sold off, that is one story. If it fell because of something specific to this company, then the dividend and the problem are connected, and buying the yield means buying the problem.
The yield itself comes last. That is the reversal that matters, because it was the only number I looked at the first time, and it was the number most likely to distract me.
There is a fourth question and it belongs to the portfolio. I had sized that position by its yield. So the riskiest thing I owned was also the largest single contributor to my income, which is the trap described in diversification explained, where a portfolio that looks spread out turns out to be one bet wearing several names.
If you own anything for its income, do this before the weekend is over. Pull up the most recent quarterly filing for each holding, find the dividend per share and the earnings per share, and do the division. Write the answer next to the ticker. Anything above about 0.8 deserves a second look at free cash flow, and how to read an earnings report shows you where to find it without reading the whole document.
The full set of measures, including ex dividend dates, dividend growth records and the other signs of a yield trap, is in dividend investing.
I still own dividend payers. I still like the discipline a regular payment imposes on a management team. What changed is which number I look at first, and the fact that the nine percent I found so attractive was, read correctly, the market telling me in advance and in public that it did not expect the company to keep paying.
Frequently asked questions
What is a yield trap?
A yield trap is a stock whose dividend yield looks unusually attractive because the share price has already fallen on concerns about the business. The high yield reflects the market's doubt that the payment will continue, and it usually disappears when the dividend is cut.
How do I check whether a dividend is affordable?
Divide the dividend per share by earnings per share to get the payout ratio, and do the same against free cash flow per share, which is harder for accounting choices to flatter. A ratio above one means the company is paying out more than it earns and is funding the difference from somewhere else.
What usually happens to the share price when a dividend is cut?
The price often falls on the announcement, because income focused holders sell and because the cut confirms the problem the market suspected. An investor who bought for the yield can therefore lose the income and take a capital loss from the same event.